NCERT Solutions for Class 8 Maths Chapter 12 Introduction to Graphs Exercise 13.1
NCERT Solutions for class 8 Maths Chapter 13 Exercise 13.1 Factorisation updated for CBSE Session 2024-25. All the question or ex. 13.1 class 8th mathematics are revised according to new syllabus and latest NCERT boos issued for CBSE 2024.25.
8th Maths Excerise 13.1 Introduction to Graphs Chapter Solutions
Following are the solutions
Solution:-
Answer:-
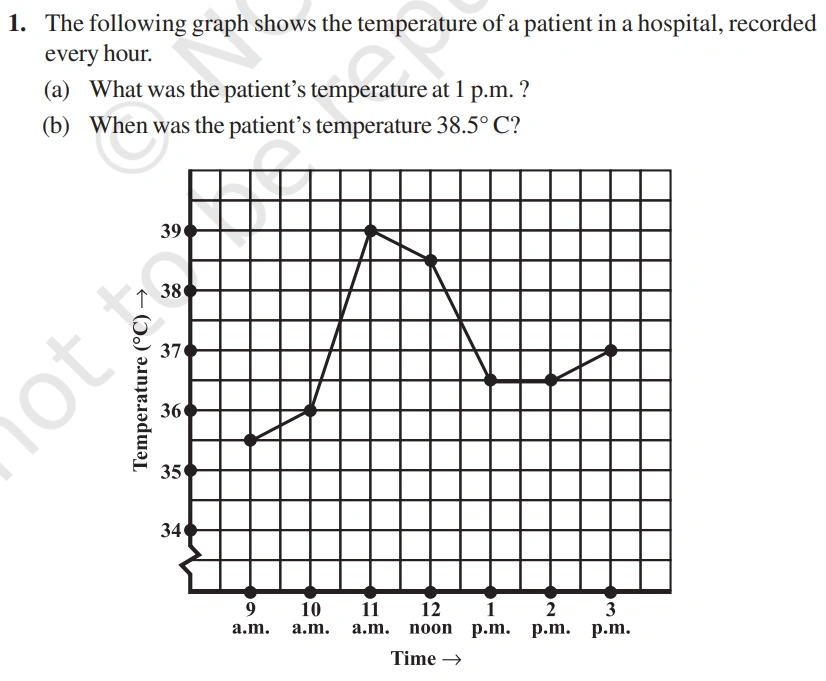
(a) The patient’s temperature was 36.5 C at 1 p.m.
(b) At 12 p.m., the patient’s temperature was 38.5 C.
(c) At 1 p.m. and 2 p.m., the patient’s temperature was the same.
(d) The graph between 1 and 2 p.m. is parallel to the x-axis. At 1 p.m. and 2 p.m., the temperature is 36.5 C. So 1:30 p.m., the temperature is 36.5 C.
(e) The patient’s temperature showed an upward trend in the following periods.
9 a.m. to 10 a.m., 10 a.m. to 11 a.m., 2 p.m. to 3 p.m.
Answer:-
(a)
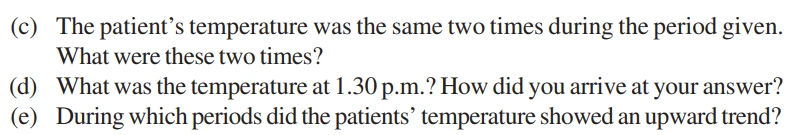
(i) The sales in 2002 were Rs 4 Crores.
(ii) The sales in 2006 were Rs. 8 crores
(b)
(i) The sales in 2003 were Rs. 7 crores.
(ii) The sales in 2005 were Rs. 10 crores.
(c) Difference between the sales in 2002 and 2006
= Rs (8 – 4) crores
= ₹ 4 crores
(d) Difference between the sales in 2006 and 2005.
= ₹ (10 – 8) crores
= ₹ 2 crores
Difference between the sales in 2005 and 2004
= ₹ (10 – 6) crores
= ₹ 4 crores
Difference between the sales in 2004 and 2003
= ₹ (7 – 6) crores
= ₹ 1 crores
Difference between the sales in 2003 and 2002
= ₹ (7 – 4) crores
= ₹ 3 crores
As a result, the difference was greatest in 2005 as compared to the prior year, 2004.
Solution:-
(a)
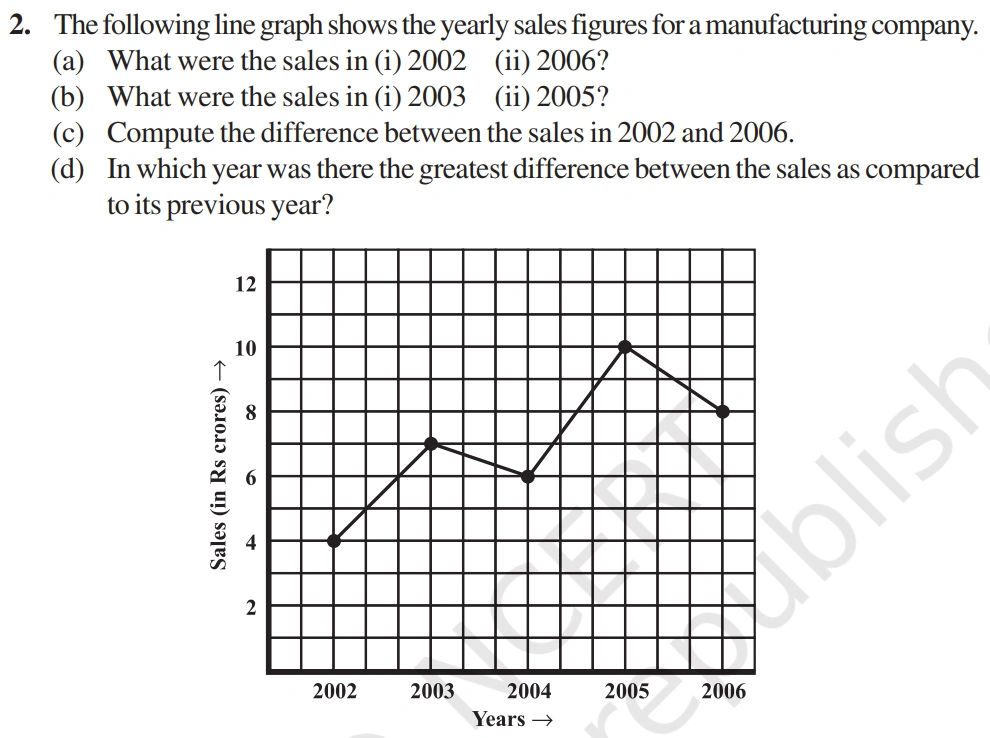
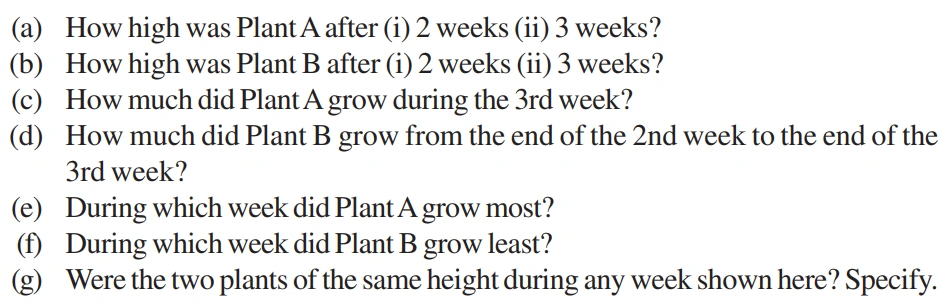
(i) The plant A was 7 cm high after 2 weeks and
(ii) after 3 weeks it was 9 cm high.
(b)
(i) Plant B was also 7 cm high after 2 weeks and
(ii) after 3 weeks it was 10 cm high.
(c) Plant A grew = 9 cm – 7 cm = 2 cm during 3rd week.
(d) Plant B grew during end of the 2nd week to the end of the 3rd week = 10 cm – 7 cm = 3 cm.
(e) Plant A grew the highest during second week.
(f) Plant B grew the least during first week.
(g) At the end of the second week, plant A and B were of the same height.
Solution:-
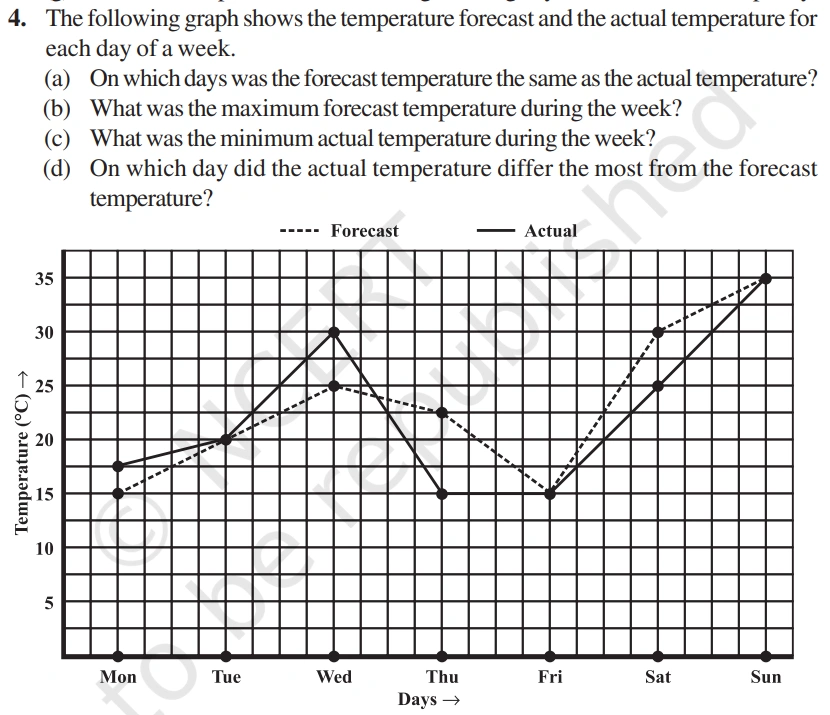
(a) on Tuesday, Friday and Sunday, the forecast temperature was same as the actual temperature.
(b) The maximum forecast temperature was 35 C.
(c) The minimum actual temperature was 15 C.
(d) The actual temperature different the most from the forecast temperature on Thursday.
Solution:-
Answer:-
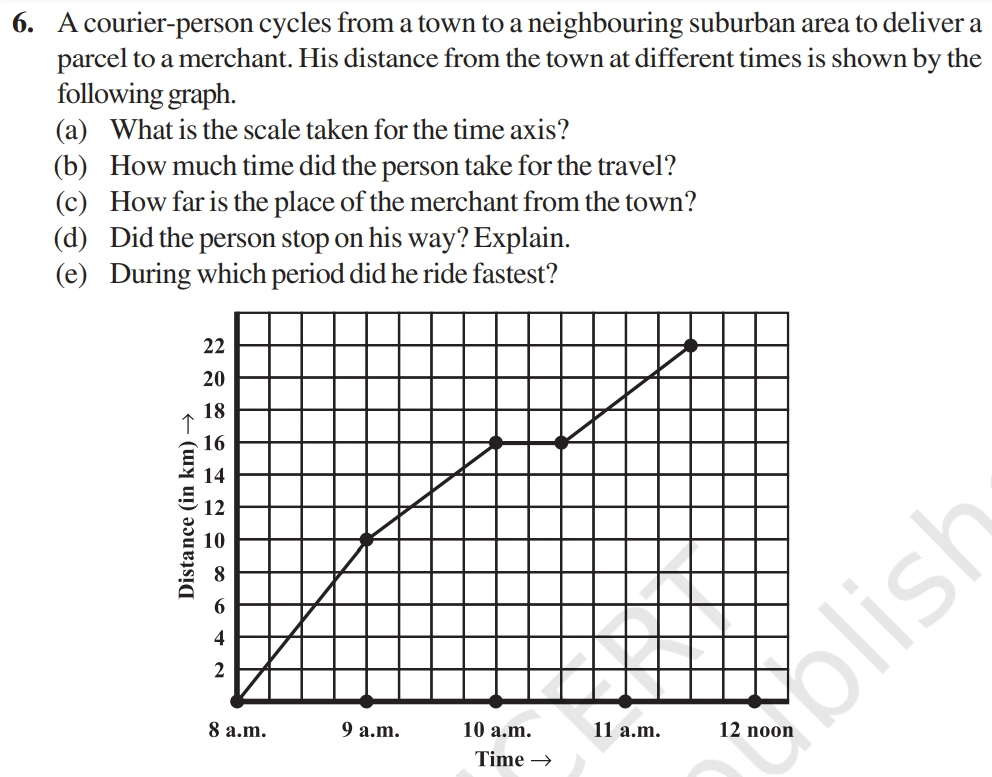
(a) 4 units = 1 hour.
(b) The person took 3 and half hours for the travel.
(c) it was 22 Km far from the town.
(d) Yes, this has been indicated by the horizontal part of the graph. He stayed from 10 am to 10.30 am.
(e) he rode the fastest between 8 am and 9 am.
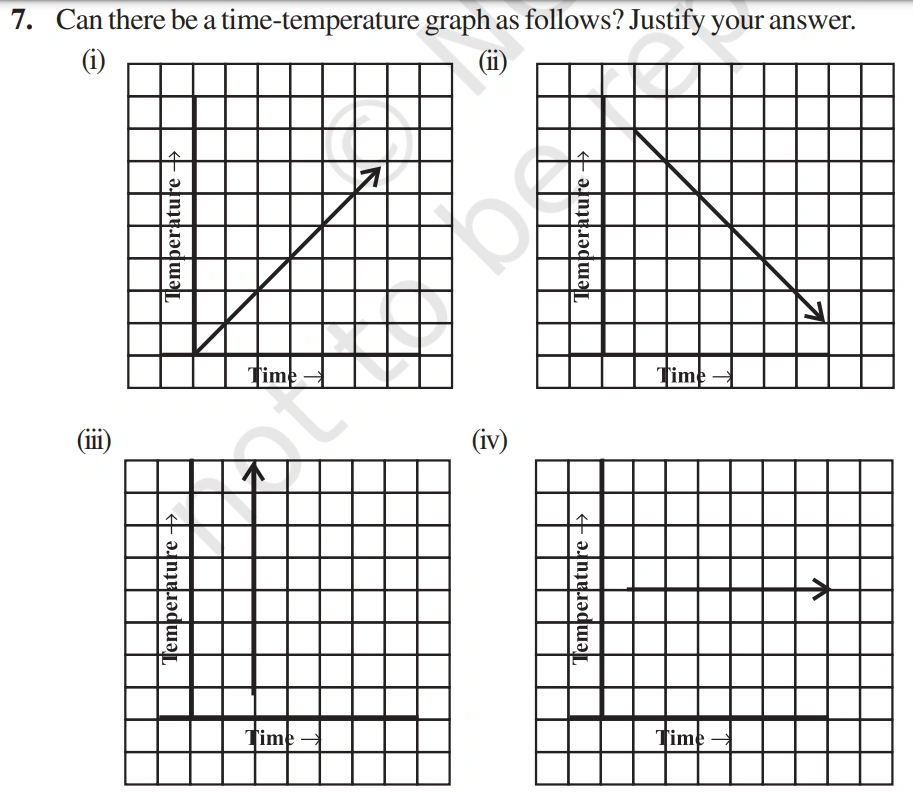
Solution:-
(i) It is showing the increase in temperature.
(ii) It is showing the decrease in temperature.
(iii) The graph figure (iii) is not possible since temperature is increasing very rapidly which is not possible.
(iv) It is showing constant temperature.